
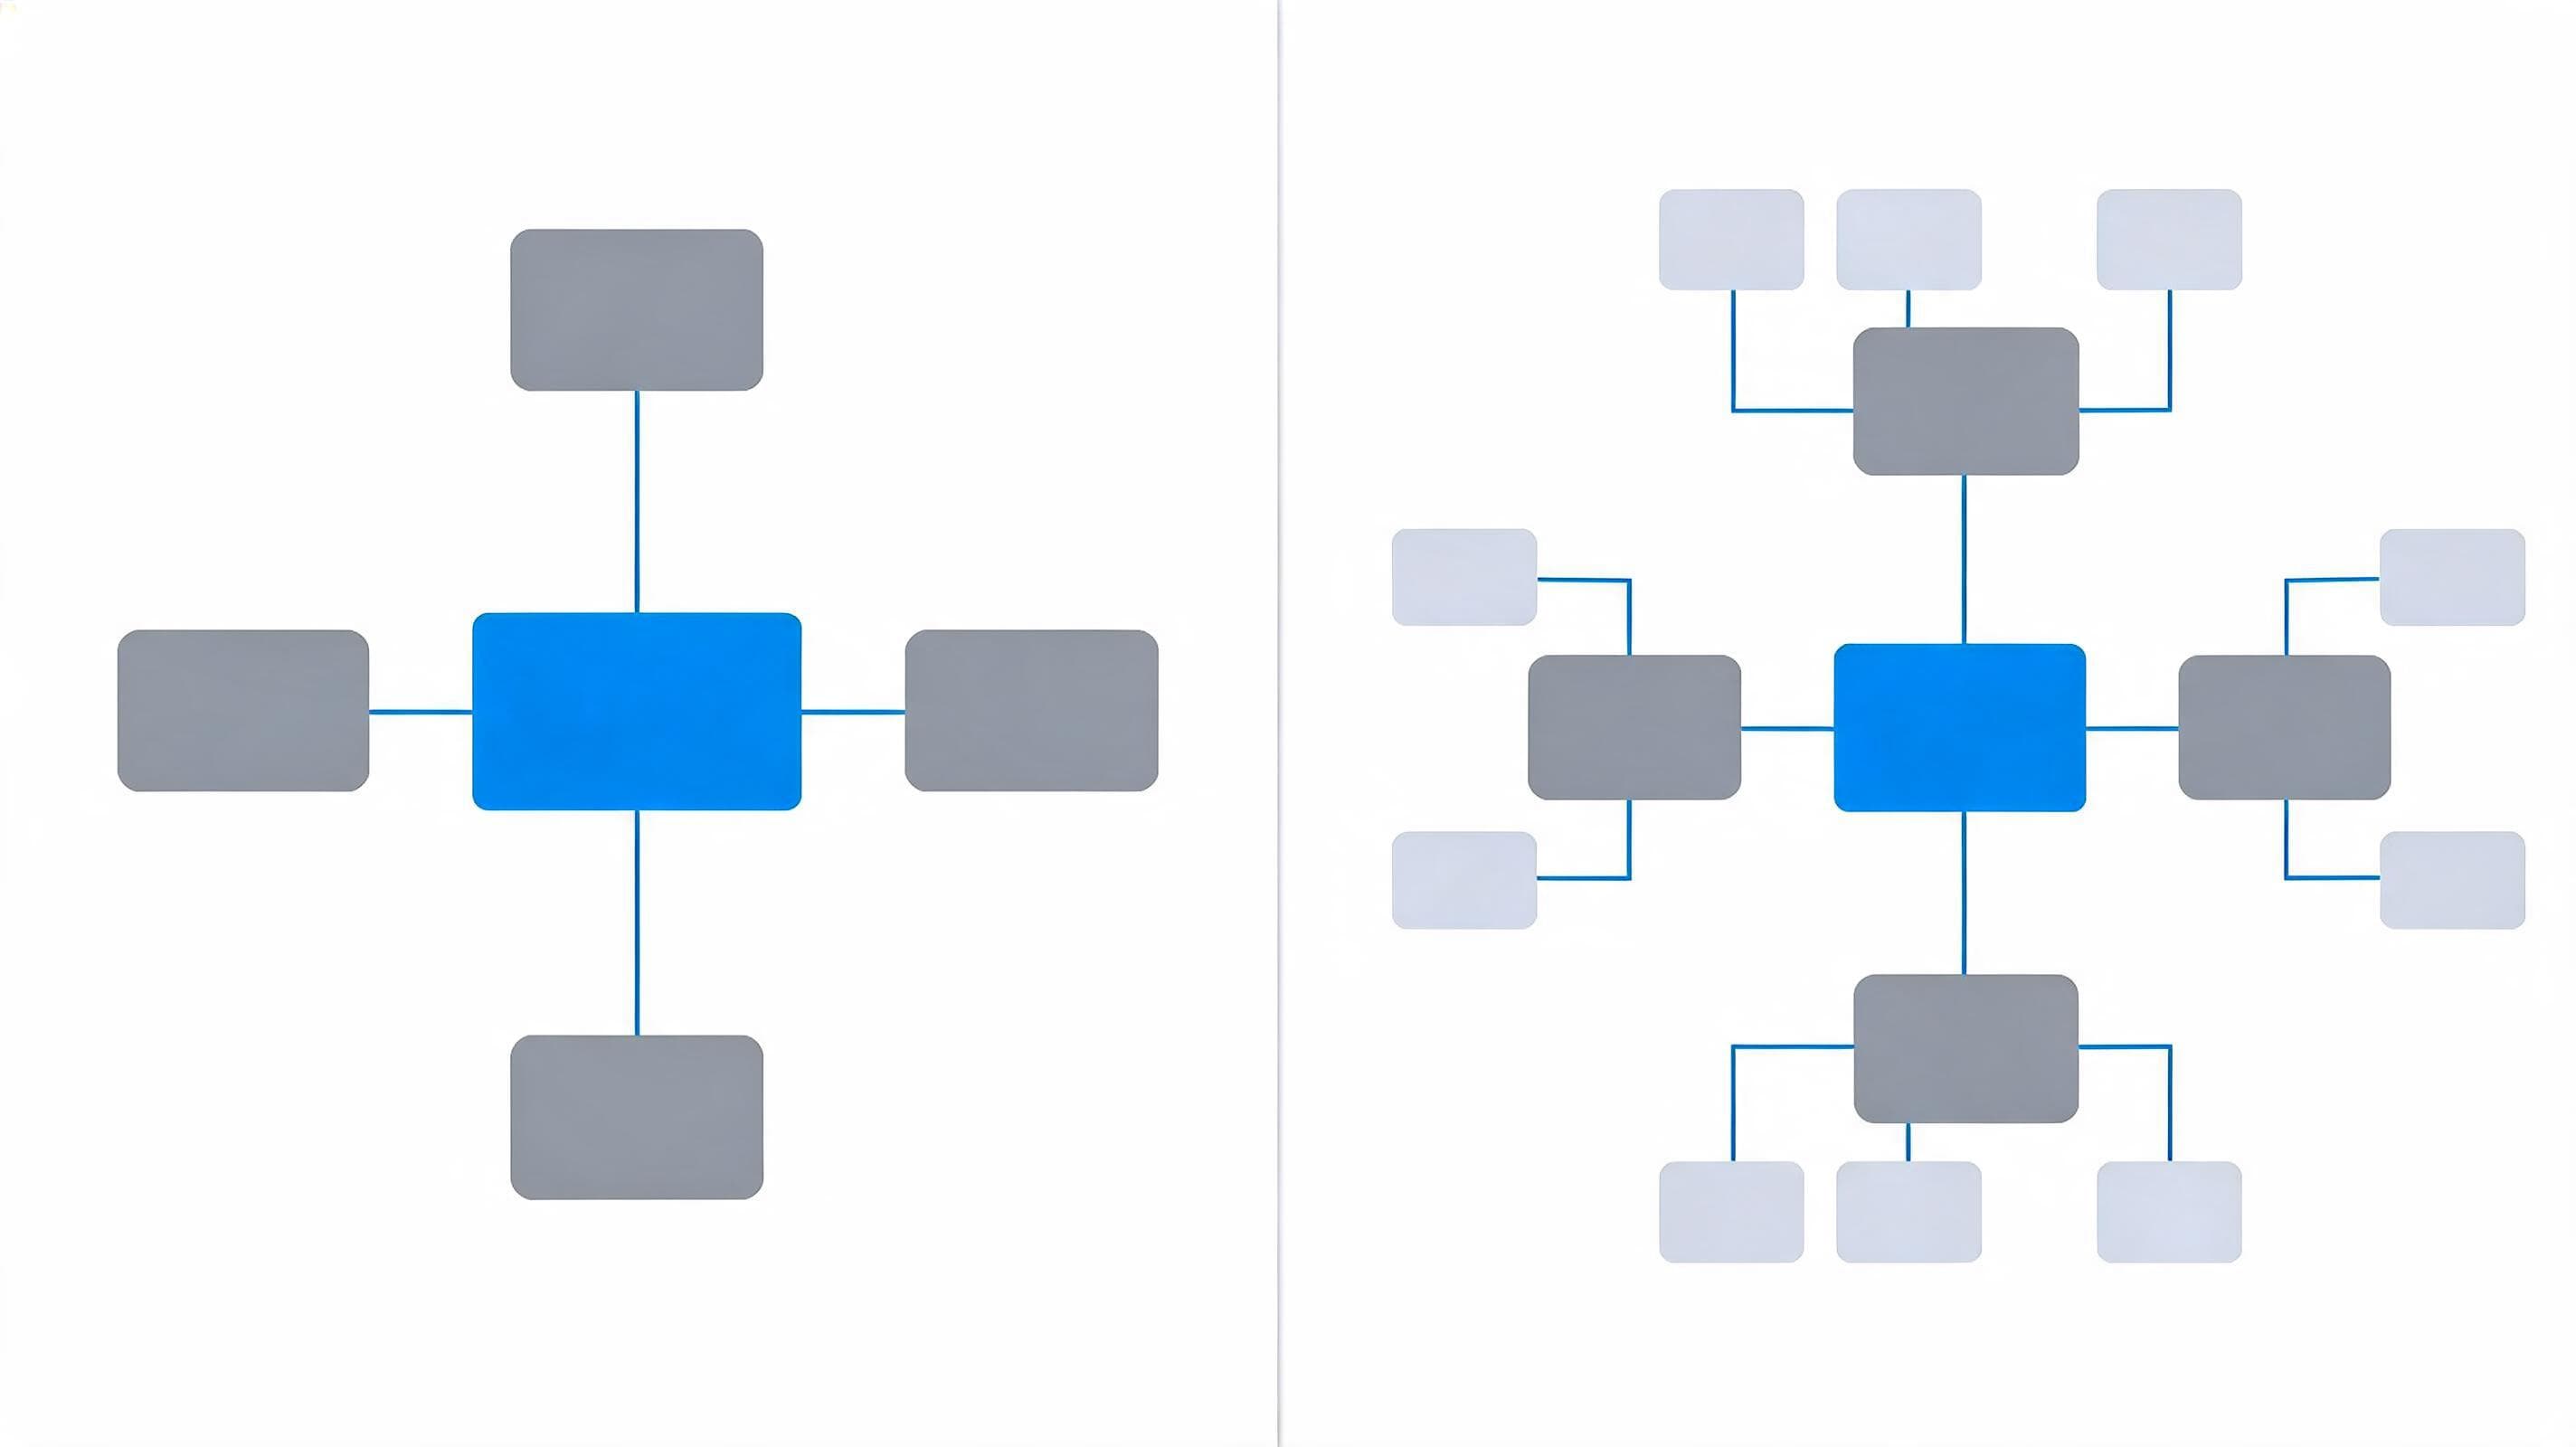
The short answer to the snowflake vs star schema question is this: a star schema is the better choice for the reporting and self-service analytics layer, while a snowflake schema is the better choice for the layer where complex hierarchies and frequently changing master data are managed. Both models use a fact table at the centre, surrounded by dimension tables. The difference between them is how far you normalise the dimension tables. This decision directly determines query speed, maintenance effort and how easily business users can reach the data.
Snowflake vs Star Schema: Core Concepts
In dimensional modelling, the fact table holds measurable events: a loan disbursement, a policy premium collection or a sales line. Dimension tables carry the context that gives the event meaning: customer, branch, product, date. Both schemas rest on this basic approach. For a detailed framework of the concept, the Kimball Group's dimensional modelling techniques page is a common industry reference.
How is a star schema built?
In a star schema, each dimension is a single, wide table. In the customer dimension, the customer's name, segment, city and region sit on the same row. The fact table links to these dimensions with just one key each. The result is a simple, star-like structure.
- A report query usually consists of a JOIN between the fact table and a few dimensions.
- Field names are close to business language; analysts quickly learn where to find what.
- The price is repeated values within the dimension. The same region name recurs across thousands of customer rows.
How is a snowflake schema built?
In a snowflake schema, dimensions are split by hierarchy level. The customer table links to a city table, and the city table to a region table. Each piece of information is stored in one place only. When a region's name changes, only 1 row is updated.
- Data redundancy decreases and referential integrity becomes stronger.
- Deep product trees or organisational hierarchies are modelled naturally.
- The price is more JOINs and a more complex semantic model.
Comparison Table: The Two Models Across 6 Criteria
The table below summarises the criteria most often debated when making decisions in enterprise projects. There is no absolute winner; look at which criterion carries the most weight for you.
| Criterion | Star schema | Snowflake schema |
|---|---|---|
| 1. Normalisation | Dimensions denormalised, single table | Dimensions normalised, multi-level |
| 2. Query complexity | Few JOINs, simple SQL | More JOINs, longer queries |
| 3. Report performance | Predictable and usually fast | Depends on JOIN count and engine |
| 4. Data redundancy | Redundancy in dimensions | Redundancy kept to a minimum |
| 5. Maintenance | A hierarchy change affects many rows | Changes are made at a single point |
| 6. Self-service use | Easy for business users | Hard without a semantic layer |
Query performance
Modern columnar data warehouse engines have reduced the cost of JOINs compared with the past. Still, the picture we see in practice has not changed: as the number of JOINs in the reporting layer grows, the execution plan becomes more complex, caching gets harder and a dashboard's load time fluctuates from user to user. A star schema reduces this fluctuation.
Storage and cost
The classic advantage of the snowflake schema is disk savings. In cloud storage this advantage has lost its former importance; the real cost now arises on the compute side. Unnecessary JOINs extend processing time per query. So while saving on storage, you must avoid losing on compute.
When assessing cost, look not at a single query but at the total workload over the day. Many users opening the same dashboard in the morning re-run the same JOIN chain on every load. Building the reporting layer as a star schema and pre-computing frequently used aggregates is the most reliable way to reduce this repeated load significantly.
Data integrity and maintenance
In banking and insurance, branch structures, product breakdowns and regulatory codes change often. Managing these changes from a single point also simplifies the audit trail. Here, a normalised structure and a strong data management discipline work together.
Which Schema for Which Scenario?
You can use the checklist below to make the decision easier. Your answers will usually stack up on one side.
- Choose a star schema: If most of your users come from business units, reports are built with drag-and-drop tools and dashboard response time is your priority.
- Choose a snowflake schema: If your dimensions contain deep hierarchies, the same reference data is fed from many sources and traceability of changes is mandatory.
- Use both in layers: If you have both regulatory reporting and a broad self-service user base.
Star schema for self-service analytics
A business user looking for a field does not want to navigate between five different tables. In self-service analytics projects, building the presentation layer as a star schema reduces the risk of creating wrong relationships and keeps the semantic model simple.
A layered structure for the enterprise data warehouse
In large organisations, the healthiest outcome usually comes from a hybrid architecture. In the integration or core layer, data is kept normalised. In the presentation layer, subject-oriented star schema data marts are produced from these tables. Integrity is thus ensured in the core, while speed and ease of use are delivered in the presentation layer.
Implementation Steps: From Choosing the Model to Go-Live
- Inventory your reports. List the most used reports and the dimensions each one needs.
- Define the grain. What does one row of the fact table represent? Do not choose a schema until this answer is clear.
- Map the hierarchies. Flag deep and frequently changing hierarchies; these are candidates for the normalised core.
- Design the presentation layer. Define the star schema data marts that business intelligence tools will read.
- Write the slowly changing dimension rules. Decide up front which fields will keep their history and which will be overwritten.
- Measure performance. Test critical reports with partitioning, aggregate tables and materialized views; validate old and new results side by side.
How Are Slowly Changing Dimensions Handled in the Two Schemas?
The issue that complicates model choice the most is dimension data that changes over time. When a customer's segment changes, should historical reports show the old segment or the new one? This question creates a different kind of complexity in each schema.
- In a star schema: To keep history, a new row is added to the dimension table, and validity dates plus a current-record flag are used. Because there is a single table, the rule is written in one place; however, in a wide table every change means copying all attributes.
- In a snowflake schema: Because the changing level is kept in a separate table, only that level is versioned. This provides flexibility; on the other hand, producing a report's correct view as of a given date requires matching the validity ranges of several tables together.
In practice, our recommendation is to identify the fields whose history will be tracked one by one, together with the business unit, at the start of the project. Any model built before it is clear which fields will be overwritten and which will keep their history will have to be revisited at the first audit report.
4 common mistakes
- Carrying the normalised structure of the source system into the reporting layer as-is.
- Mixing records of different grain in the same fact table.
- Building shared dimensions (date, customer, branch) separately in each data mart, with different definitions.
- Feeding dimension tables without assigning an owner for the reference data.
The BIART Bilişim Perspective
Our experience in enterprise projects shows that the schema debate often starts with the wrong question. The real question is not “which model is better” but “which user are we serving in which layer”. With our technology-independent approach, we first clarify reporting needs and data ownership, then propose a layered structure that preserves integrity in the core and simplicity in the presentation layer.
Common mistakes confirm this view: forcing the entire warehouse into a single schema, leaving the grain undefined and neglecting the semantic layer. Avoiding these three mistakes makes more of a difference than the choice of model.
If you would like to assess your data warehouse architecture together, let's work together on your project. Get in touch.
Frequently asked questions
What is the main difference between a star schema and a snowflake schema?
The difference lies in the normalisation level of the dimension tables. In a star schema each dimension is a single, wide table; in a snowflake schema dimensions are split into linked sub-tables by hierarchy level. That is why a star schema is queried with fewer JOINs, while a snowflake schema reduces redundancy.
Which model delivers faster queries?
Usually the star schema. The query engine joins the fact table directly to the dimensions and the execution plan stays simple. A snowflake schema adds extra JOIN steps; although this gap narrows on modern columnar engines, the star schema behaves more predictably in the reporting layer.
Which schema is recommended for self-service BI tools?
A star schema is recommended for self-service analytics. Business users find fields in a single dimension table, the risk of creating wrong relationships falls and the semantic model stays simple. If there are normalised sources, they should be flattened through a view or an ETL step and presented to users as a star structure.
Can the two models be used together in the same data warehouse?
Yes, and this is the most common structure in enterprise projects. Normalised (snowflake-like) tables are kept in the core or integration layer, while star schema data marts produced from these tables are opened up for reporting in the presentation layer.
How is an existing snowflake model converted to a star schema?
First, the most used reports and their dimensions are identified. Then the sub-tables are flattened into the main dimension table, surrogate keys are preserved, slowly changing dimension rules are retested, and the migration is completed after comparing the report results of the old and new models side by side.