
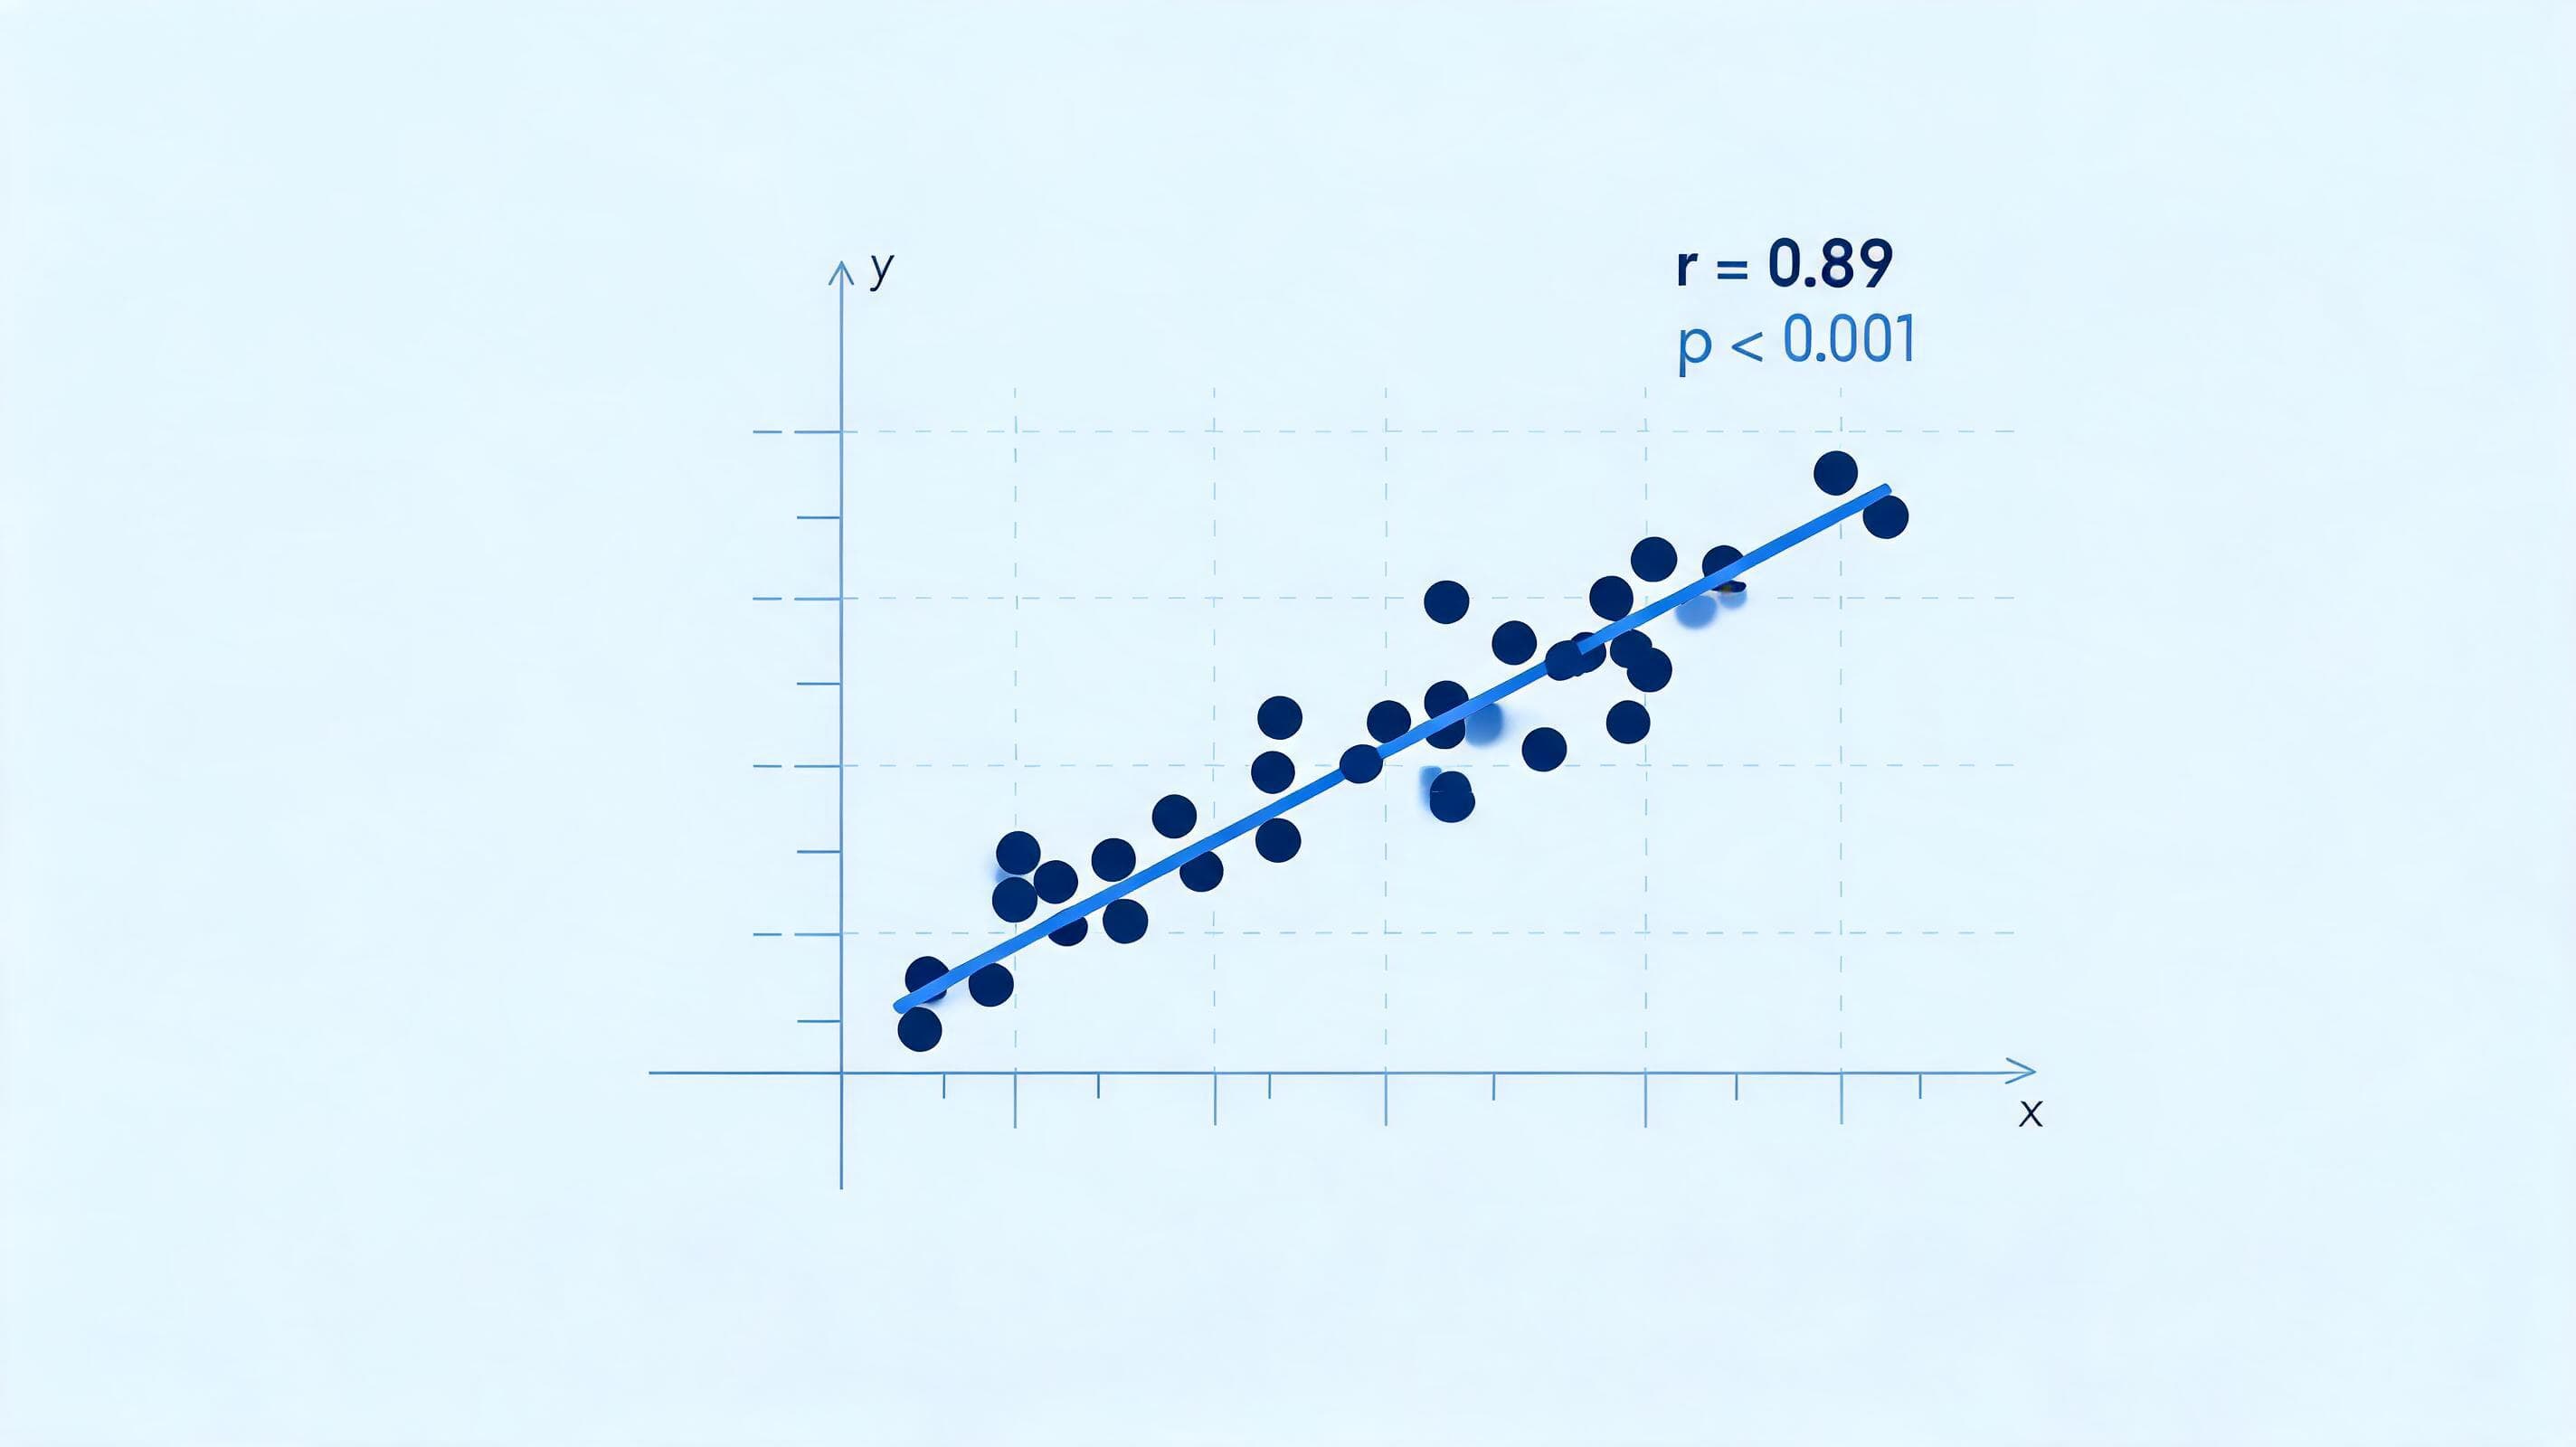
What is correlation? Correlation is a statistical measure that expresses the direction and strength of the relationship between two variables numerically. It shows whether one variable also changes when the other one changes. The result is summarized by a correlation coefficient between -1 and +1; however, this value alone does not prove a cause-and-effect relationship.
At BIART Bilişim, while running data warehouse, reporting and analytics projects in banking, insurance, energy and public institutions, the most common mistake we see is correlation results being interpreted without context. This guide is designed to help you read the relationship between variables correctly.
What Is Correlation? Basic Definition and Its Place in Statistics
One of the first questions in data analysis is this: are two measurements related to each other? Correlation analysis gives a numerical and comparable answer to this question. It underlies variable selection, risk assessment and reporting decisions.
Meaning and Logic of the Word Correlation
The word comes from Latin roots meaning "together" and "relation". Its logic is simple: if two variables move together in a certain pattern, there is a correlation between them. This pattern may be in the same direction, in the opposite direction, or absent altogether.
Understanding the Relationship Between Two Variables
Consider the relationship between a branch's monthly campaign spending and the number of new customers. If the number of customers rises as spending rises, the link between the variables is strong. The first step in understanding this relationship is to visualize the data on a scatter plot. The chart clearly reveals patterns that the coefficient may hide.
What Is the Correlation Coefficient (r) and How Is It Interpreted?
The correlation coefficient reduces the relationship to a single number. Its most common notation is the letter "r". Because it is independent of units, variables on different scales can be compared.
Coefficient Value Range (Between -1 and +1)
- +1: perfect positive linear relationship
- 0: no linear relationship
- -1: perfect negative linear relationship
Determining the Strength and Direction of the Relationship
The sign shows direction, and the absolute value shows strength. The thresholds below are a commonly used practical guideline; they may vary by field.
| |r| range | Interpretation (guideline) |
|---|---|
| 0.00 - 0.19 | Very weak |
| 0.20 - 0.39 | Weak |
| 0.40 - 0.59 | Moderate |
| 0.60 - 0.79 | Strong |
| 0.80 - 1.00 | Very strong |
It is important to read strength and direction together: a value of r = -0.75 means a strong negative correlation.
The Importance of Statistical Significance (p-value)
In small samples, a high r value can occur by chance. That is why the p-value is reported together with the coefficient. The p-value expresses the probability of seeing such an extreme coefficient if the relationship did not actually exist. A low p-value provides statistical significance, but it does not guarantee that the relationship is practically important. Always state the sample size as well.
What Are the Types of Correlation?
Positive Correlation (Moving in the Same Direction)
When one variable increases, the other increases too. Example: working hours and the number of units produced. Positive correlation is recognized by an r value greater than zero.
Negative Correlation (Moving in the Opposite Direction)
When one increases, the other decreases. Example: the age of a machine and its production efficiency. Negative correlation means an r value less than zero, and it is very valuable for risk management.
Zero Correlation (No Relationship)
If the r value is close to zero, no linear relationship is observed. This does not mean there is no relationship; the relationship may exist in a non-linear form.
The Most Common Correlation Analysis Methods
The choice of method depends on the data type and distribution.
| Method | What does it measure? | When? |
|---|---|---|
| Pearson | Linear relationship | Continuous, approximately normally distributed data |
| Spearman | Monotonic relationship (rank) | Ordinal data, outliers or non-normal distribution |
| Kendall Tau | Rank concordance | Small samples, many ties |
Pearson Product-Moment Correlation
Pearson correlation measures the linear relationship on raw values. It is sensitive to outliers; check the data distribution before applying it.
Spearman Rank Correlation
Spearman correlation uses the ranks instead of the values. It captures relationships that are continuously increasing or decreasing (monotonic) even if they are not linear. This is the key difference from Pearson: one looks at the magnitude of values, the other at their ranking.
Kendall Tau and Partial Correlation
Kendall Tau is based on rank concordance and is preferred for small samples. Partial correlation, on the other hand, isolates the relationship between two variables by holding the effect of a third variable constant. It is useful when a hidden factor is suspected.
The Critical Difference Between Correlation and Causation
Is Moving Together a Cause-and-Effect Relationship?
No. Correlation only shows co-movement. A relationship between A and B may mean that A causes B, that B causes A, that a common third factor drives both, or that it is a coincidence. Causation is tested with controlled experiments and appropriate causal inference methods.
What Is Spurious Correlation and Examples
Spurious correlation is when two variables appear related even though they do not actually affect each other. A classic, hypothetical example: in summer months, ice cream sales and boating accidents may rise together. The common factor is hot weather. In business data too, if two indicators are both affected by seasonality, a misleading link appears between them.
Differences Between Correlation and Regression
Detecting Relationships vs Prediction
- Correlation: summarizes the direction and strength of the relationship; the variables are symmetric.
- Regression: builds a model that predicts the dependent variable from independent variables; the roles of the variables are defined.
A common workflow is to first discover the relationship with correlation, then build a prediction model with regression.
Practical Uses of Correlation in Different Fields
Risk Management in Finance and Investment Portfolios
Portfolio diversification relies on correlation. When assets with low or negative correlation to each other are held together, total volatility decreases. For example, while one stock falls, an asset that moves in the opposite direction can partially offset the loss. Remember that correlations can change during crisis periods.
Clinical Research in Medicine and Health Sciences
In clinical research, correlation is used to examine the relationship between a measurement and a health indicator. This helps generate hypotheses; a randomized controlled trial is needed to prove the effect of a treatment.
Multicollinearity Checks in Data Science and Machine Learning
A correlation matrix is prepared before modeling. This matrix shows the coefficients of all variable pairs in a single table. If two independent variables are very highly correlated with each other, a multicollinearity problem arises; regression coefficients become unstable and harder to interpret. Implementation steps:
- Build the correlation matrix and visualize it with a heat map.
- Identify the highly correlated variable pairs.
- Based on business knowledge, drop one of them or combine the variables.
- If necessary, verify the result with additional diagnostic measures.
Such work requires a reliable data management infrastructure; poor-quality data corrupts every coefficient calculated. To trace where data comes from, you can read our article on data lineage and data trust. To spread analyses across the organization, business intelligence and self-service analytics solutions are used. In big data environments with many variables, the correlation matrix should also be computed on a scalable platform.
Common Mistakes in Correlation Analysis and What to Watch For
The Effect of Outliers on the Analysis
A single outlier can noticeably raise or lower the Pearson coefficient. Ways to address this:
- Detect outliers visually with a scatter plot.
- Investigate whether it is a data entry error or a genuine extreme case.
- Also calculate and compare the Spearman correlation, which is robust to outliers.
- Always document the decision to remove a point and its rationale.
Overlooking Non-Linear Relationships
Pearson measures only linear relationships. If there is a U-shaped (quadratic) relationship between variables, the coefficient can come out close to zero even though the link is very strong. For example, if a process's efficiency peaks at a certain temperature and drops on both sides, this non-linear pattern does not show up in the r value. That is why you should not read r = 0 as "no relationship".
Anscombe's Quartet: The Importance of Visualization
Statistician Francis Anscombe's quartet consists of four datasets with the same mean, variance and approximately the same correlation coefficient (about 0.816). Yet when you look at the charts, one is linear, one is curved, one has an outlier, and one depends on a single extreme point. The lesson is clear: always interpret the coefficient together with a scatter plot.
Sources and Conclusion
To go deeper, you can look at the Correlation article on Wikipedia, the Anscombe's quartet article and NIST's e-Handbook of Statistical Methods. For our reference projects, you can review our references page.
In short, correlation is a powerful but, on its own, insufficient tool for discovering relationships. Choose the right method, check for outliers and non-linear patterns, and avoid causal claims. To build a reliable data analysis infrastructure in your organization: Let's work together on your project. Contact Us
Frequently asked questions
What does it mean if the correlation coefficient is -1?
There is a perfect negative linear relationship. When one variable increases, the other decreases in exact proportion. It is rarely seen in real data; if it appears, check whether there is a calculation or duplicated-data error.
Why does correlation not imply causation?
Correlation only shows co-movement. A hidden third variable, coincidence or reverse causation can produce the same result. Experimental design or causal inference methods are needed to show causality.
What is the difference between Pearson and Spearman correlation?
Pearson measures the linear relationship on raw values and is sensitive to outliers. Spearman uses the ranks of the values; it captures monotonic relationships and is more robust to outliers.
What does spurious correlation mean?
It is when two variables appear statistically related, even though they do not actually affect each other, because of a common third factor or coincidence.
What does correlation mean in medicine?
In clinical research, it describes the co-movement between a risk factor and an outcome. A controlled study is needed to prove a treatment effect.
What is the main difference between correlation and regression?
Correlation summarizes the direction and strength of a relationship with a single coefficient. Regression builds a model that predicts one variable from another and distinguishes the roles of the variables.
How does negative correlation protect a portfolio in finance?
When assets whose prices move in opposite directions are held together, a loss in one is partially offset by a gain in the other, and the portfolio's total volatility decreases.