
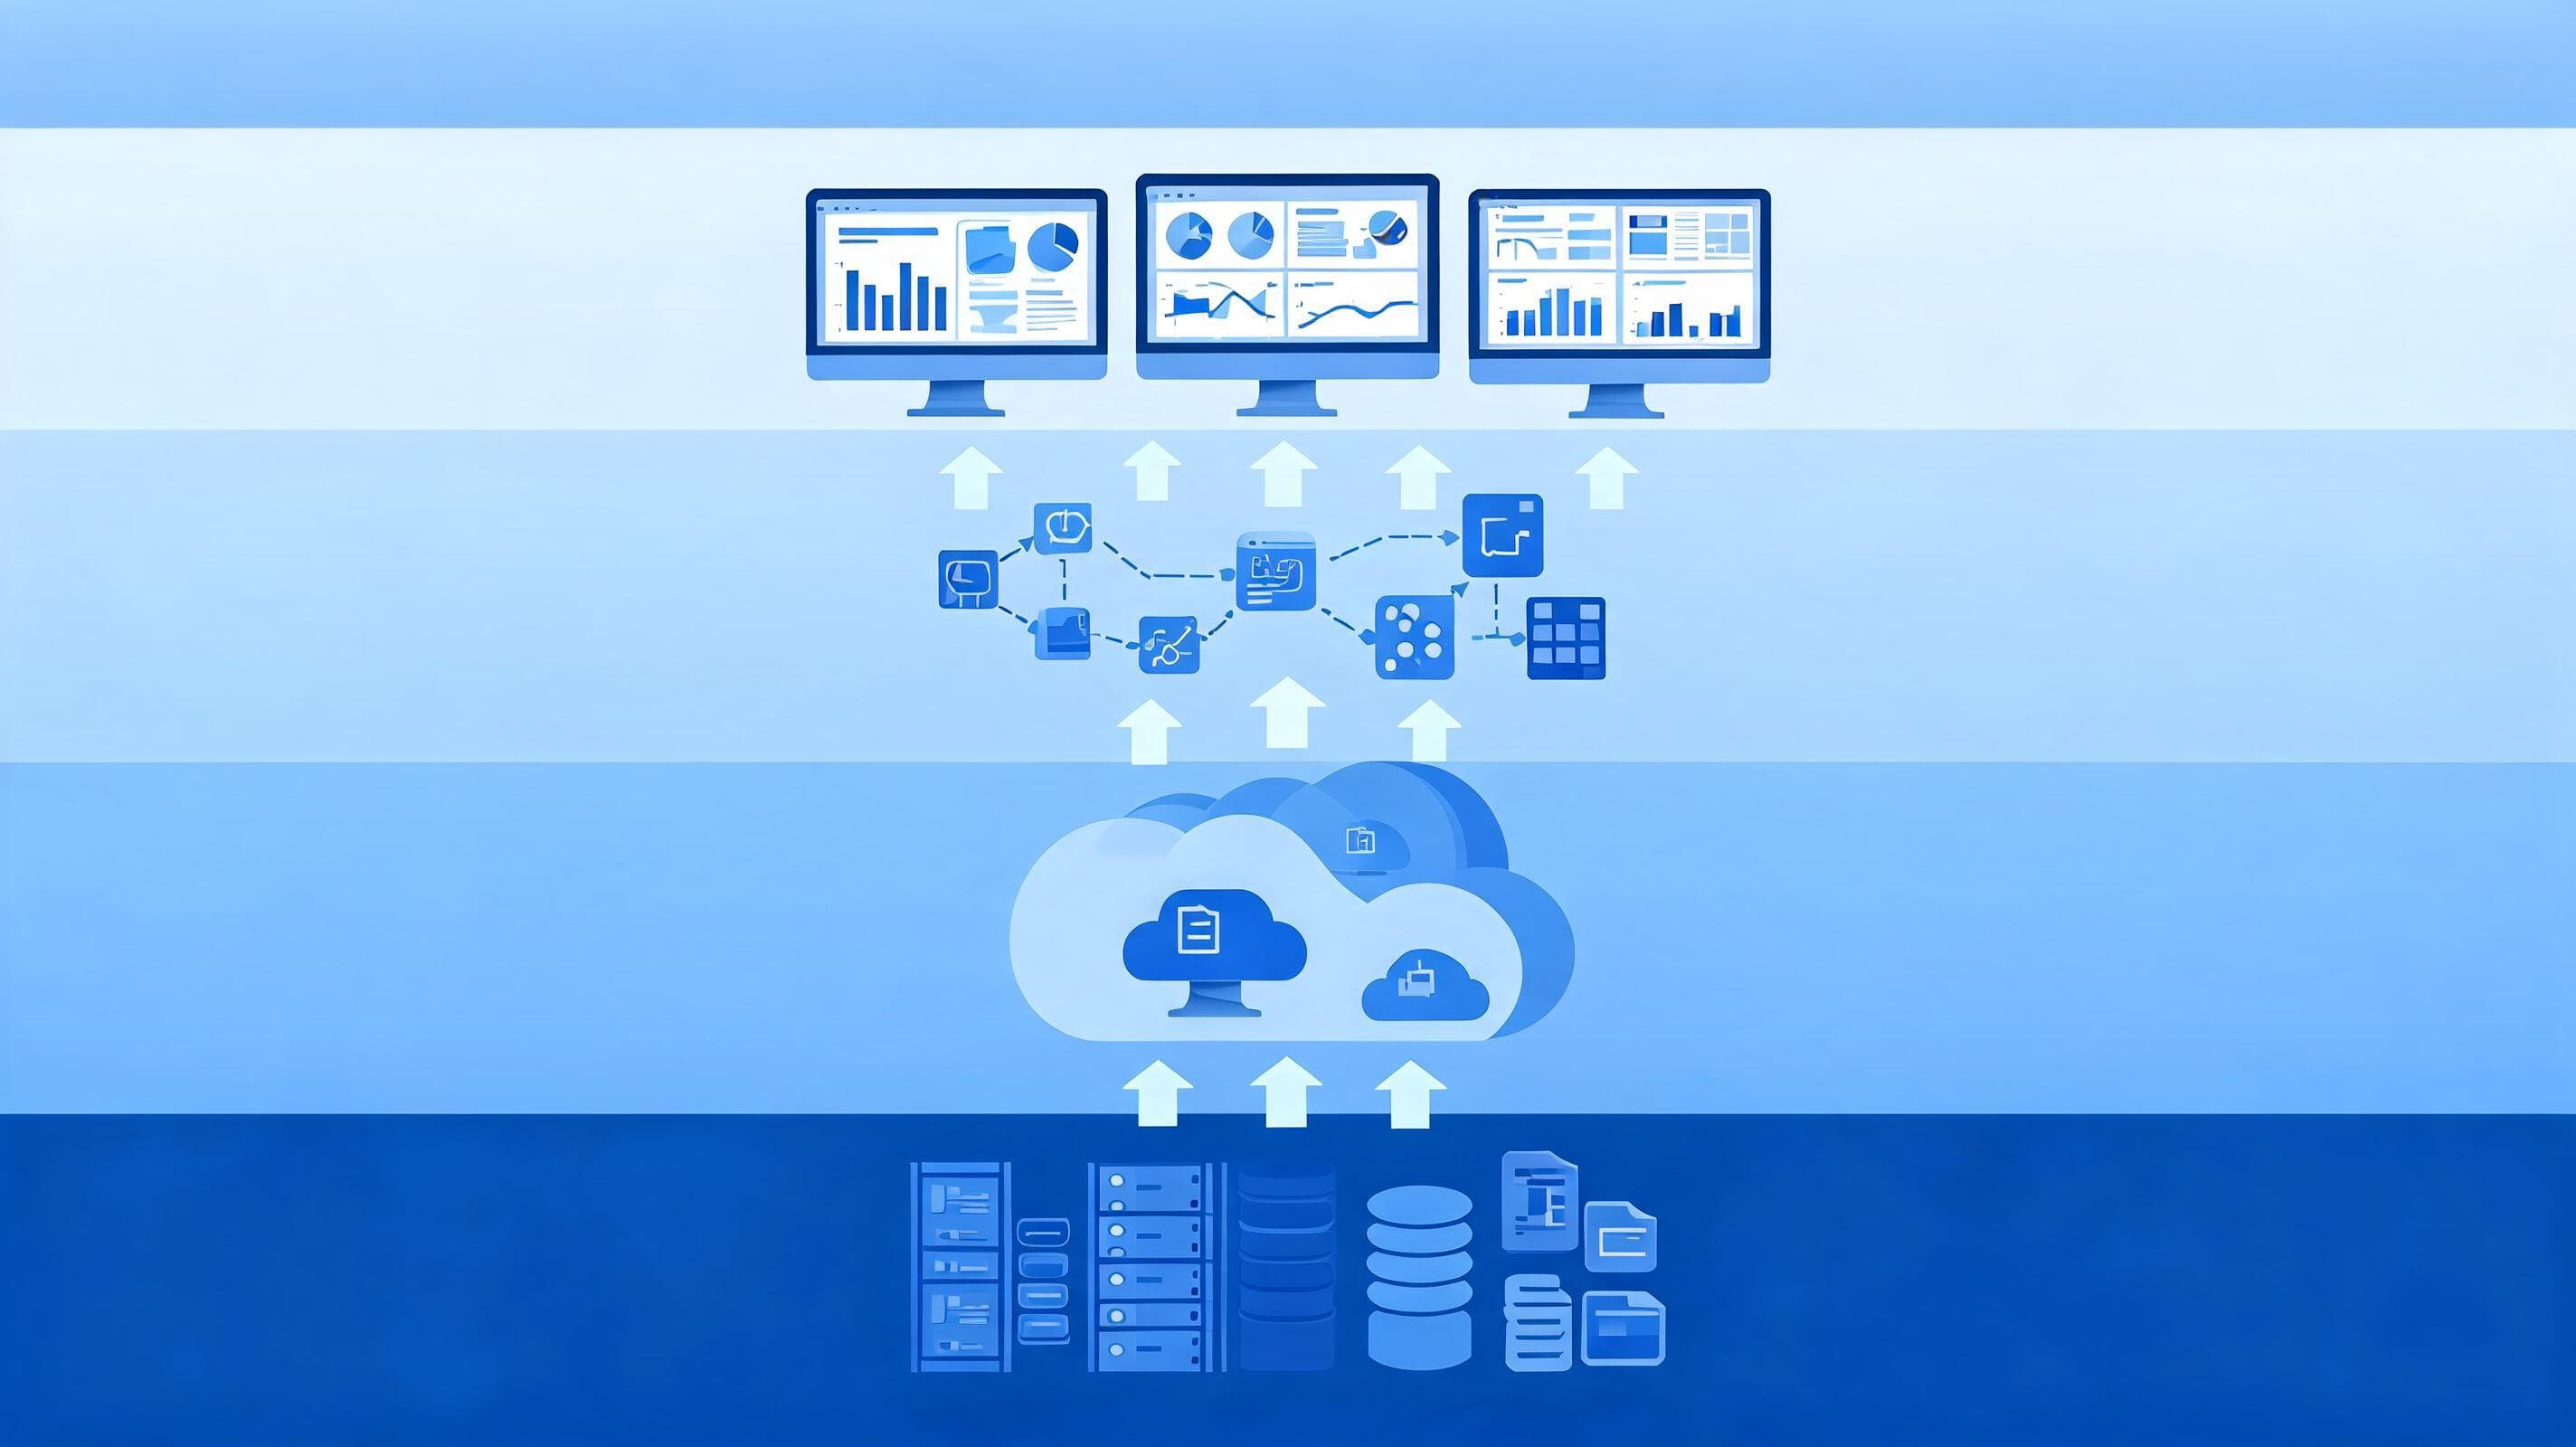
Self-service BI is an analytics approach that lets business units build their own reports on governed, trusted data without opening a request to the IT team. A tool alone is not enough to make it work at enterprise scale. A shared data model, a semantic layer, access management and data quality rules must be set up together.
In this article, we explain the layers, governance rules and implementation steps of a self-service BI architecture for large organizations. The goal is to deliver fast reporting without compromising security.
What is self-service BI and why does it need an enterprise architecture?
Self-service BI spreads analysis from a central team out to the business units. Finance, risk, sales or operations teams get answers to their own questions directly from the data. However, uncontrolled spread causes the same metric to produce different results in different reports. That is why, in an enterprise setting, architecture comes first and tools come second.
Limits of the classic reporting model
In the traditional model, every report request goes into the IT queue. This structure creates several problems:
- Even a small field change can take weeks.
- Because IT does not fully know the business logic, there are repeated rounds of corrections.
- Instead of waiting, business units produce Excel files and the data gets scattered.
- Multiple "correct" numbers appear for the same indicator.
A properly built self-service analytics structure breaks this cycle. The IT team stops being a report producer and becomes the owner of the data platform.
Core layers of a self-service BI architecture
A scalable architecture consists of four layers. The responsibility of each layer is kept separate.
| Layer | Role | Owner |
|---|---|---|
| Data sources and integration | Collects ERP, core systems, file and streaming data | Data engineering |
| Data warehouse / lakehouse | Stores cleansed, modeled and historized data | Data engineering |
| Semantic layer | Gathers metric and dimension definitions in one place | IT and business unit together |
| Reporting and discovery | Delivers dashboards and ad hoc analysis | Business unit users |
Data sources and integration
The first layer brings together the scattered sources across the organization. Systems such as SAP, Logo and Netsis, along with event data flowing through Kafka, are connected to the same platform. Batch and streaming loads are planned separately here. For reports that do not need real-time data, a daily load is often enough. A data owner and a refresh frequency are defined in writing for every source.
Data warehouse or lakehouse
The second layer holds data that is ready for analysis. Dimensional models such as the star schema simplify queries and improve performance. For help choosing a model, see our Snowflake vs. Star Schema comparison. Data quality rules are also applied at this layer. Faulty data must be caught before it reaches reports. For the fundamentals, see our data management service page.
Semantic layer
The semantic layer is the most critical part of self-service BI. Definitions such as "net revenue", "active customer" or "overdue balance" are written here once. Users drag and drop these definitions into their reports. That way, when two teams look at the same indicator, they see the same number. When a definition changes, it is updated in a single place and all reports automatically reflect the new value.
Reporting and discovery tools
The last layer is the face the user sees. Power BI, Tableau or similar tools can be used. If the architecture is built independently of the tool, switching tools later is not costly. Microsoft's Power BI guidance documents offer detailed direction for governed self-service setups. In enterprise business intelligence projects, tool selection is made after the architecture.
Governance: Balancing freedom and control
Self-service does not mean "everyone can reach all data." Governance defines a safe space for the user. A good model rests on three principles: access control, traceability and data ownership.
Role and permission model
Permissions are defined by role. With row-level security, a regional manager sees only the data of their own region. Personal data is masked. When processing personal data, compliance with the regulations of the Personal Data Protection Authority (KVKK) is mandatory in sectors such as banking and insurance. The permission matrix should be reviewed for every new dataset.
Data lineage and trust
Users must be able to see where a number comes from. Data lineage shows the path from source to report. When a source system changes, you know in advance which reports will be affected. We covered this topic in detail in our guide on data lineage and data trust. In addition, certified datasets must be clearly separated from experimental ones.
Example scenario: Risk reporting at a bank
The example below is a hypothetical scenario summarizing a situation we often see in banking projects. The risk unit wants to see delinquency rates in the loan portfolio every week. In the old model, the team asks IT for a new report each time. By the time the report arrives, the data has gone stale.
In the self-service model, the following structure is set up:
- Core banking data is loaded into the warehouse with a nightly load.
- The "delinquency rate" and "non-performing loan" metrics are defined once in the semantic layer.
- Risk analysts build their own breakdowns using the certified dataset.
- Customer identity information is masked and branch-level row security is applied.
- Thanks to data lineage, the audit team can trace the source of every number.
As a result, analysts do not wait for IT for a new breakdown. The IT team, in turn, focuses on platform work such as new data sources and quality rules. For our work on similar projects, see our references.
Self-service BI tool selection criteria
Looking only at the interface when choosing a tool can be misleading. Use the criteria below as an evaluation checklist:
- Integration: Does it connect smoothly with your existing data warehouse, SAP and other sources?
- Security: Does it offer row-level security, masking and audit logging?
- Manageability: Does it support certified datasets, versioning and publishing processes?
- Scalability: Is performance maintained as user and data volumes grow?
- License cost: How does the distinction between reader and creator users affect the budget?
- Skills: Does the team's current knowledge match the tool's learning curve?
A technology-independent approach makes it possible to run an impartial comparison against these criteria.
Self-service BI implementation steps
Making a large transformation all at once is risky. The sequence below enables pilot-focused, measurable progress.
- Choose the business area. Start with an area that has a high reporting load and a clear data source, for example risk or sales performance.
- Define the metrics. The business unit and IT put the most important metrics in writing together.
- Build the data model. Bring the sources into the warehouse, add quality rules and create the dimensional model.
- Publish the semantic layer. Gather certified datasets in a single catalog.
- Train the users. Upskill team leaders with short workshops. Appoint a "data champion" in each unit.
- Enable permissions and monitoring. Track usage and performance metrics.
- Plan the rollout. Apply the lessons from the pilot to the next units.
Change management in self-service BI
The technical setup is half of the job. The other half is changing habits. Users have worked with Excel and ready-made reports for years. The following practices help during the move to the new model:
- Senior management uses only certified dashboards in meetings.
- Data champions become the first point of support in their own units.
- Short videos and a library of sample reports keep training continuous.
- Old reports are shut down on a set date, so the two systems do not live side by side for long.
These steps ensure the tool is actually used. A platform that is not used produces no value, however well it is built.
Common mistakes
- Buying the tool first. Without a data model, a tool only produces better-looking chaos.
- Skipping training. Even if users know the tool, they must learn to interpret the data correctly.
- Ownerless datasets. Every dataset must have a named owner.
- Ignoring performance. A slow dashboard sends users back to Excel.
- Leaving governance for last. Controls added afterwards often create user resistance.
How to measure success
Base success on tracked indicators, not on guesses. The measures we recommend are:
- The change in the number of report requests opened with IT.
- The time it takes a report to go from request to publication.
- The share of users who use certified datasets.
- The number of inconsistent reports for the same metric.
- The number of monthly active users.
Record a baseline by measuring these indicators before the rollout. That way, you can prove the improvement with your own data.
Conclusion
Enterprise self-service BI is less about buying a tool and more about an architecture and operating model decision. With a strong data layer, single-definition metrics and clear permission rules, business units move faster and the IT team focuses on strategic work. With its technology-independent approach, BIART Bilişim designs an architecture that fits your existing infrastructure and builds KVKK compliance into the process from the start.
Let's work together on your project. Get in Touch.
Frequently asked questions
What is self-service BI?
It is an approach that lets business unit users build their own reports and analyses on governed, trusted datasets without waiting for requests to the IT team.
Does self-service BI eliminate the need for the IT team?
No. The role of the IT team changes. Instead of producing reports, it manages the data infrastructure, the semantic layer, security and governance.
Which tool should I choose: Power BI or Tableau?
The right tool depends on your existing infrastructure, license model and user skills. If the architecture layers are built independently of the tool, switching tools becomes easier.
Does self-service BI put data security at risk?
If row-level security, role-based permissions and data masking are set up correctly, the risk stays under control. Data covered by KVKK requires additional oversight.
How long does implementation take?
The duration depends on the number of data sources and the data quality. You usually start with a pilot in a single business area and then expand to other units.